Customizable Pivot Support/Resistance Zones [MyTradingCoder]This script uses the standard pivot-high/pivot-low built-in methods to identify pivot points on the chart as a base calculation for the zones. Rather than displaying basic lines, it displays a zone from the original pivot point to the closest part of the available body on the same candle. The script comes in handy by utilizing Pinescripts available input.source() function to allow for an external indicators output value to be used within the indicator. Make sure to read all of the TOOLTIPS in the indicator settings menu to get a full understanding of what each setting does, and how it can affect the results that end up on the chart.
By enabling the custom filter in the indicator settings, you will notice you have the ability to filter out zones using an external indicator such as an RSI. Maybe you only want zones to be calculated/drawn when the RSI is overbought or oversold, or maybe you only want the zones to calculate/draw if the Supertrend is green or red. The list of possible filters that you can implement is too many to count. Feel free to play around with the indicator however you like, and configure something that you find to be the most useful for your trading.
On top of everything listed above, the indicator has pre-programmed built-in alertconditions so that you can potentially automate trading, or get a notification to your cell phone when a zone is being touched/broken.
스크립트에서 "pivot points"에 대해 찾기

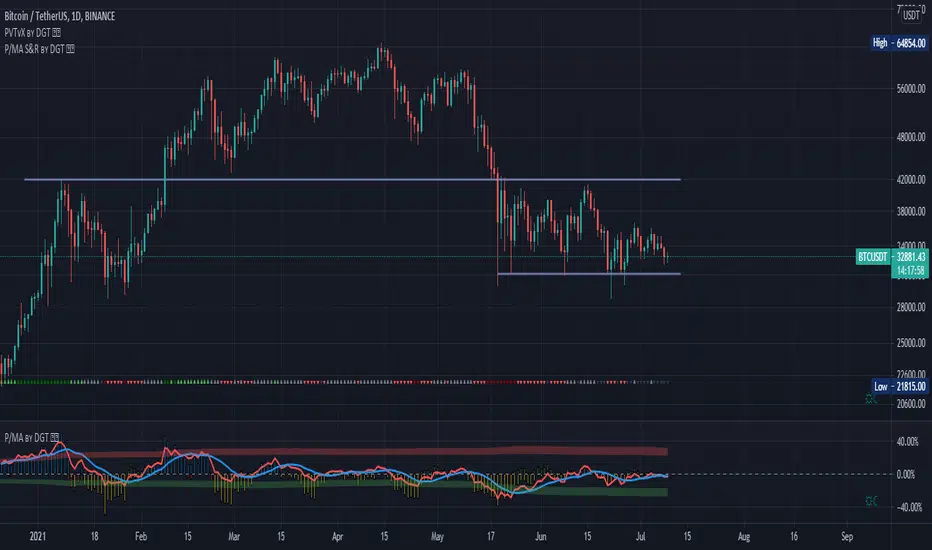
Volume Profile, Pivot Anchored by DGTVolume Profile (also known as Price by Volume ) is an charting study that displays trading activity over a specified time period at specific price levels. It is plotted as a horizontal histogram on the finacial isntrumnet's chart that highlights the trader's interest at specific price levels. Specified time period with Pivots Anchored Volume Profile is determined by the Pivot Levels, where the Pivot Points High Low indicator is used and presented with this Custom indicator
Finally, Volume Weighted Colored Bars indicator is presneted with the study
Different perspective of Volume Profile applications;
Anchored to Session, Week, Month etc : Anchored-Volume-Profile
Custom Range, Interactive : Volume-Profile-Custom-Range
Fixed Range with Volume Indicator : Volume-Profile-Fixed-Range
Combined with Support and Resistance Indicator : Price-Action-Support-Resistance and Volume-Profile
Combined with Supply and Demand Zones, Interactive : Supply-Demand-and-Equilibrium-Zones
Disclaimer : Trading success is all about following your trading strategy and the indicators should fit within your trading strategy, and not to be traded upon solely
The script is for informational and educational purposes only. Use of the script does not constitutes professional and/or financial advice. You alone the sole responsibility of evaluating the script output and risks associated with the use of the script. In exchange for using the script, you agree not to hold dgtrd TradingView user liable for any possible claim for damages arising from any decision you make based on use of the script

Distance Oscillator - Support and Resistance by DGT
Prices high above the Moving Average (MA) or low below it are likely to be remedied in the future by a reverse price movement as stated in the article by Denis Alajbeg, Zoran Bubas and Dina Vasic published in International Journal of Economics, Commerce and Management
This study is the third variant that aims to present this idea, and the output of the study is presented as lines that serve as possible support and resistance levels in the future.
1st variant of the idea is presented as an centered oscillator, link to Price Distance to its MA Study , within its description you may find more about the idea and some statistical observations. Also some derivatives with MACD-X, More Than MACD and P-MACD
2nd variant of the idea are presented as colored triangle line (Volatility Colored Price/MA Line), using the same calculation methods and presented in the bottom of price chart.
Link to studies where it is included : Colored Directional Movement and Bollinger Band's Cloud , SuperTrendRange and Pivot Points vX
3rd variant (this study) as stated earlier aims to present the same idea as support and resistance levels.
Options
The users can adjust source and length of the moving average that is used as base for the distance oscillator
Signal triggering options includes length for the deviation bands, multiplier as well as smoothing of the oscillator
Line customization settings
Additionally an alert can be configured to be warned earlier to watch out for probable pullbacks or reversals
Technical details for whom interested
Calculating the price distance to the MA results in a centered oscillator lets call it Distance Oscillator (quite similar to the RSI), as shown in the blow chart
Unlike RSI, oscillations with the distance oscillator are not limited within a specific range, hence identifying overbought and oversold is not as straight forward as it is with RSI. To determine overbought and oversold levels, standard deviation of distance oscillator is calculated and bands generated with the same approach applied with Bollinger Bands.
Once we have the threshold bands then crossing those bands we may assume as important levels and draw a line, if oscillator values keeps above the threshold bands (deviation bands) the logic behind the code will update the line drawing accordingly.
To reduce noise a smoothing can be applied
Alerts :
Please note that the implementation applied here can be applied to any oscillator such as RSI, Stochastic, MFI etc even Volume (if bear candle volumes are multiplied by -1)
Disclaimer :
Trading success is all about following your trading strategy and the indicators should fit within your trading strategy, and not to be traded upon solely
The script is for informational and educational purposes only. Use of the script does not constitute professional and/or financial advice. You alone have the sole responsibility of evaluating the script output and risks associated with the use of the script. In exchange for using the script, you agree not to hold dgtrd TradingView user liable for any possible claim for damages arising from any decision you make based on use of the script
Strongholds - Objective & Accurate Reference Points / StructuresVery early in my trading career, I came across Pivot Points only to find out that there are as many calculations as one pleases. It was hard to find out which ones work. Most of them probably did only out of randomness, so I ditched the strategy and looked for something else.
I previously used my Oracle Eye and Reference Points scripts but it is time for an upgrade.
Stronghold is a script I have used for quite some time now. I ditched daily and weekly closing prices as not that important. Instead, Strongholds are equipped with:
►Daily High & Low • Azure color
►Weekly High & Low • Dark blue
►Weekly old High & Low • Semi-transparent dark circles
►Monthly High & Low • Wizardly purple
There is an option to print:
►4h High & Low • Semi-transparent red
►VWAP • Lovely purple
►Weekly VWAP • Black
All of the levels and lines are set for 1m, 5m, 10m, 15m, 30m, 1h, 4h, 1D timeframes. If you use any alien timeframe, you may need to enter the code.
You can opt-in and out for certain timeframes. For example, daily levels are visible from 15m or 30, so the indicator won't draw them unless you want to. However, they will not be seen on higher timeframes as there is no reason to show them and oversaturate the chart with lines.
▬▬▬▬▬▬▬▬▬▬▬▬▬▬▬▬▬▬▬▬▬▬
Remember that if you use this script with auto-scale, you need to tick Scale Price Chart Only . Otherwise, your chart will fly to the moon!
Good luck & have fun!

Daily Pivot (Traditional)Hello all
-
This code is for daily pivot points, support and resistance with pivot labels and value.
simple code with no bugs.
this code use previous day values on online chat and current day values on offline chat.
pivot values are placed on right side, so no overlapping with other values.
.
.
Thank you Trading View for other educational script to make this possible.

Fibonacci Pivots Monthly and Weekly Full (no history)Fibonacci Pivots Monthly and Weekly Full (no history)
Inspired by FxChartAnalyst trader, with his great Monthly Weekly Daily Pivot Points Standard indicator
www.tradingview.com
This indicator calculates and plots both Monthly and Weekly pivots on a chart. Pivots are based on the Fibonacci ratios of the previous Month/Week candle close.
Good luck everyone!

Alternative Daily Reference Points for Intra-hour ChartsThis is a different version of my www.tradingview.com used high, lows and pivots. One problem with pivot points is the number of calculation methods. The alternative version shows historical lows, closes, highs one basic period back.
► On lower timeframes - hour or less - this will show High, Low and Close from the previous day, two days ago, the previous week and two weeks ago and VWAP.
► On 1h daily reference points need to be enabled. On higher timeframes, daily reference points will not be shown. On the daily chart, weekly levels need to be enabled to still show and will be disabled on all higher periods.
► It is configured only for normal timeframes. If you use something like 17-minutes timeframe, you will have to allow this timeframe in the code.
Bear in mind, using all lines at the same time can be a little confusing and price doesn't react to every one of them. You can probably disable lows in the uptrend or scratch closes to simplify your chart.
Have a great trade!

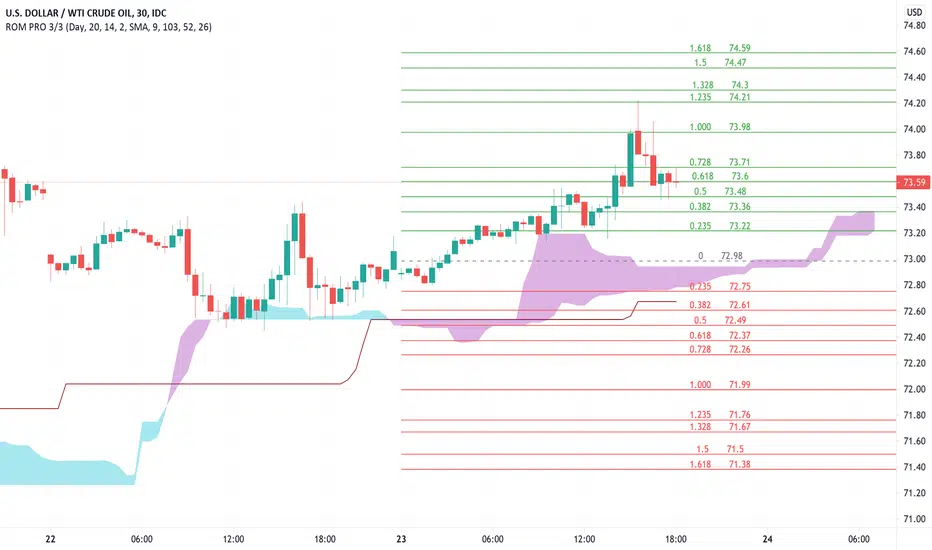
Rain On Me PRO 3/3This is the part 3 of Rain On Me PRO. It follow my two other indicators "Rain On Me" and "Rain On Me V2". This version is called "PRO" because it is less "user-friendly" than the two previous versions. But it is more faster, and cleaner than ever!
This indicator is separated into 3 parts. You can find all parts into my profile in the « Scripts » section. Once the 3 parts together, the indicator is complete.
Here are the features for this part:
-MTF Fibonacci on 10 levels with level 0 in the middle and an "info panel" to indicate you the key levels. You can set an alert for each level cross.
-MTF High/Low (Red dots is last low and green dots is last high).
-Bollinger.
-Ichimoku Cloud with baseline (red) and alerts (SenkouA and SenkouB Cross or Tenkan and Kijun Cross).
Everything is fully customizable in settings.
To place an alert, always choose the "Once per bar" option.
Many functions are still to come. So don't hesitate to report bugs, suggestions and follow me to always be kept informed of the next updates to come!
//ALWAYS DELETE INDICATOR AND ALERTS AND RESET THEM AFTER AN UPDATE!
Thank again everyone for your support!
A BIG THANKS TO QUANTNOMAD FOR GIVING ME ITS AUTHORIZATION TO USE, MODIFY AND REPUBLIC ITS "Ultimate Pivot Points Alerts" script indicator:
Good trade everyone! And remember, money management is the most important!
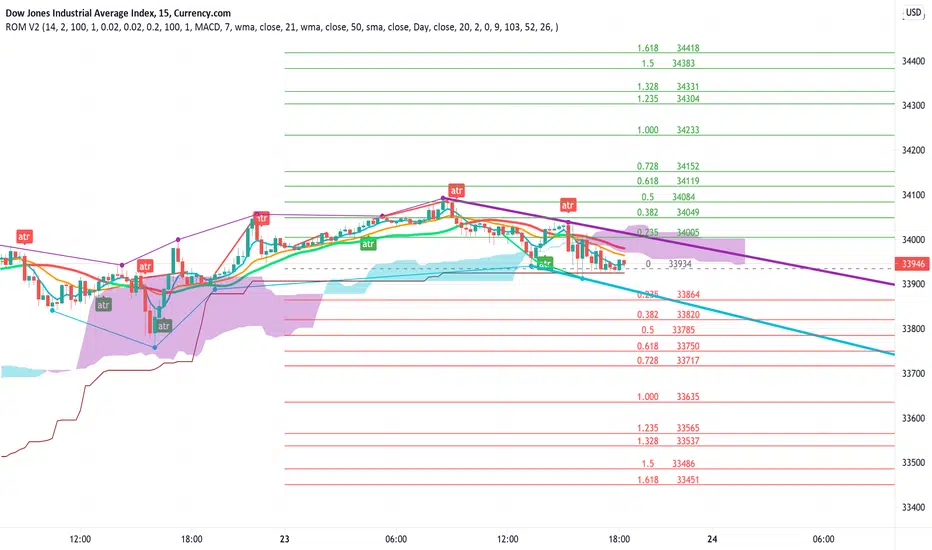
Rain On Me V2As promised, here is Rain On Me Indicator V2! As the name suggests, this indicator will rain money down on you. More seriously, Rain On Me V2 is a complete overhaul of the V1.
For those who are new to this indicator or for those who already knew it, here is a complete description of this indicator.
This indicator contains:
-Fully configurable multi-timeframe buy or sell signals based on ATR with the possibility to set the period, deviation, period of the ATR and choose the source or type of signals: RMA, SMA , EMA, WMA, VWMA, SMMA, KMA, TMA, HullMA, DEMA, TEMA, CTI.
-Colouring of candles on ATR. (green and red).
-Buy or sell signals with VPT (based on st_dev) with the possibility of adjusting the period and the multiplier. (Only works in markets with available volume information flows).
-Trend Parabolic SAR (Up / Down) fully configurable.
-Divergences with the possibility of choosing among the following signals: MACD, OBV, RSI, CCI.
-3 Moving averages with the possibility of choosing their values and their type for each one: SMA, EMA, RMA, WMA, VWMA. (default: WMA 1 = 7, WMA 2 = 21 and SMA 3 = 50).
-Fibonacci on 10 levels with level 0 in the middle. This Fibonacci helps a lot as it can make it easy for you to find an entry / exit point, a trend and even where to place your Take Profit and Stop Loss.
-Fully customizable Bollinger Band.
-Fully customizable Ichimoku cloud.
-Multi-timeframe Trendline that tells you the true trend of the current market based on volume. (Only works in markets with available volume information flows). It can change from green (for an uptrend) or red (downtrend) color.
To place an alert, always choose the "Once per bar" option.
You can place alerts on the following options:
-GO Buy / GO Sell (ATR).
-VPT Buy / Sell.
-PSAR (Up / Down).
-Divergences (Bullish / Bearish).
-Crossing of moving averages 1 and 2.
-Fibonacci key levels (0.382, 0.5 and 0.618) for Crossunder and Crossover in an uptrend or downtrend.
You can choose to show or hide from the chart all the options mentioned above.
Never follow buy or sell signals stupidly. Always watch that all the indicators are going in the same direction, that you are not in a range zone, that there is no resistance etc ...
Always wait for confirmation after a buy or sell alert before entering a position to make sure the label stays on the chart and doesn't disappear.
Please feel free to give your ideas, suggestions or bug reports in the comments area to help me improve it.
A BIG THANKS TO QUANTNOMAD FOR GIVING ME ITS AUTHORIZATION TO USE, MODIFY AND REPUBLIC ITS "Ultimate Pivot Points Alerts" script indicator:
Good trade everyone! And remember, money management is the most important!
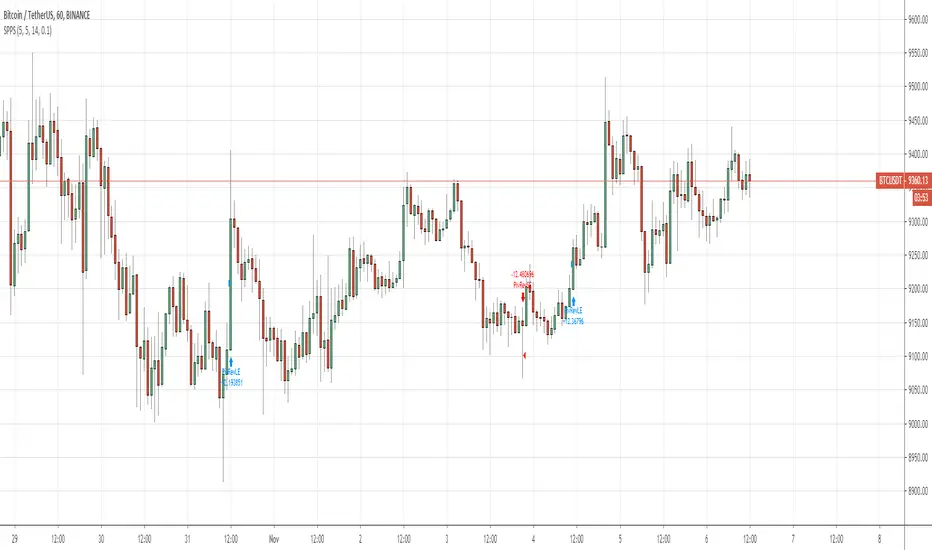
Rain On Me IndicatorFinally, we made it :D
Rain On Me Indicator, As the name suggests this indicator will make money rain on you. More seriously, this indicator contains :
This indicator contains:
-Bullish and bearish RSI divergences showing on chart with alerts.
-Parabolic SAR with Labels on chart with buying or selling alerts.
-3 Moving Average (MA 1 : 7, MA 2 : 21 MA 3 HIDDEN : 50 (Cross alerts for Pullback)
-Customizable Bollinger band
-Fibonacci on 10 levels with the level 0 to the middle. This Fibonacci help a lot since it can let you find easily entry/exit point, trend and even where to place your Take Profit and Stop Loss. It have alerts for most important levels (0.382, 0.§, 0.618) for Crossunder and Crossover in Bullish or Bearish trend.
-Fully Customizable Ichimoku Cloud.
-Trend Buy/Sell Labels on chart with buying or selling signal alerts.
-Trend color visible on candles.
If an alert trigger of Buy/Sell Signal with the same alert based on PSAR, so you can be confident to enter in position. Alway checking fibs level that is the key thing with this indicator. the script has been set to have the best possible results on as many market as possible. But.best result for zfter backtesting is on
Forex : EUR/USD, USDJPY, USDCAD.
Indice : S&P500, NASDAQ, DOWJONES
Commodities : OIL, WTI
Everything work on following timeframe :
15MN, 1H, 4H, DAILY, WEEKLY.
So that you can avoid having to set it again, whether it be in minutes, hours, days, months.
So you can easily trade in the mode that suits you best. It works well on everything from indices to forex to commodities etc. I thank all those who allowed me to carry out this project. IF you feelt free to give your ideas, suggestions, for improve it by sending me messages.
This is really a first version sp it may contain bugs / errors that will be fixed over time.
A BIG THANK YOU TO QUANTNOMAD WHO GIVE ME HIS PERMISSION TO USE, MODIFY AND REPUBLISH HIS "Ultimate Pivot Points Alerts" Script Indicator :
Good trade to all !

Trend Lines v2Hello Everyone. After working on new and better trend lines script for couple of weeks, finally I am proud to publish Trend Lines v2.
How it works?
- On each bar it finds last 10 higher and lower Pivot Points (PP).
- from first bar to 10. PP it search if a trend line is possible
- for each it starts searching from the last PP.
- it check if drawing a trend line possible or not and also it's broken or not
- if it's broken then optionally it shows broken trend lines as dotted
- if it finds a continues trend line and stop searhing more and draw trend line (I did this to make the script faster, otherwise you may get error because of it needs time more than .2sec)
- the script makes this process for each PP
optionally trend lines may be Solid or Dashed
optionally you may get rid of broken trend lines if you think it's crowded
and sometimes you may not see any trend line on the chart. this means you need to adjust the period for Pivot Points accordingly
also I made a video. if you watch this video you can see how the script works.
Important! after you add this tool to the chart you may need zoom-in and zoom-out to see all lines!
I thought a lot to make it free or not then I decided make it free and open source. you should know there is a lot of effort for this script, so if you think this is usefull please consider a donation ;)
Enjoy!

QuantNomad - Significant Pivot Reversal StrategyI'm working on improving the Pivot Points Reversal Strategy.
As one of the ways to filter out insignificant levels I decided to check that pivot point is not above/below neighbors, but check that it's above/below at least by a certain amount.
I use ATR, so in params, you can set length of ATR and also ATR multiplier. The new level will be calculated only if PP will be above/below neighbors by atr * atr_mult.
It seems this approach might help in some cases.
Here I have PivotPoint + RSI strategy:
Pivot Point 3.0English:
Indicator that calculates the pivot points "Monthly, weekly and daily" also calculates the pivots of the day / week / month, following based on the current quote, useful for finding support and resistance zones.
Español:
Indicador que calcula los puntos pivote "Mensuales, semanales y diarios" tambien va calculando los pivotes del dia/semana/mes, siguiente en funcion de la cotizacion actual, util para encontrar zonas de soporte y resistencia.
Pivot deviation code from linear regression used
pivots taken from
so we hybrid the two of them, so insted the linear regression we use the P point of the pivot
the aime here is to see better the true resitance and support level that tradition pivot is missing

QuantNomad - Pivot Reversal Strategy - XBTUSD - 1hPivot reversal strategy almost always works pretty good for crypto.
Here is setup with 4 left, 4 right bars for pivot points for XBTUSD 1h chart.
It shows a pretty nice performance of 350% with only 10% dd, Sharpe is 1.16.
If you're interested in using this strategy in my scripts you can find alerts for it and a version with added backtesting range.
And remember:
Past performance does not guarantee future results.

Standard Deviation Pivot pointsSupport Resistance points that are calculated based on the standard deviation of the traditional pivot point(previous session's high, low and close). More often stocks tend to oscillate between 3 levels of deviation forming day's high or low. A breakout of the 3rd SR level with volume indicates a strong trend day.

Elliott Wave Pattern AnalyzerElliott Wave Pattern Analyzer
Overview
This indicator automatically detects Elliott Wave impulse patterns and diagonal formations on your chart. It analyzes price structure based on classic Elliott Wave rules and displays wave counts with confidence scores, Fibonacci projections, and invalidation levels.
Why I Built This
After reading Glenn Neely's book on Elliott Wave theory, I wanted to put my learning into practice by building something tangible. There's no better way to understand a concept than trying to code it!
I'll be honest – corrective wave patterns (zigzags, flats, triangles, combinations) were simply too complex for me to implement reliably. So instead, I focused on what I could manage: impulse waves and diagonal patterns. Maybe someday I'll tackle the corrections, but for now, this is my humble contribution.
The retracement visualization style was inspired by LuxAlgo's elegant approach – credit where credit is due!
How It Works
1. Wave Detection
The indicator uses pivot points to identify potential 5-wave structures:
WaveRuleWave 2Cannot retrace more than 100% of Wave 1Wave 3Cannot be the shortest among Waves 1, 3, 5Wave 4Should not overlap Wave 1 territory (impulse)Wave 5Completes the motive structure
2. Pattern Types
Impulse Waves
Classic 5-wave motive structure
Wave 3 typically extends (≥1.618 of Wave 1)
Strict mode enforces all Elliott rules
Diagonal Patterns
Ending diagonal (wedge-shaped)
Waves progressively contract
Lines 1-3 and 2-4 converge to an apex
Often signals trend exhaustion
3. Confidence Scoring
Each pattern receives a confidence score (0-100%) based on:
Fibonacci ratio adherence
Wave proportion relationships
Rule compliance
Structural clarity
Only patterns exceeding your threshold (default: 60%) are displayed.
4. Fibonacci Projections
After Wave 5 completion, the indicator projects potential retracement levels:
0.382, 0.500, 0.618, 0.786 of the entire impulse
5. Extension Channel
Connects Wave 0 origin to the retracement low, projecting:
0.618, 1.000, 1.272, 1.618 extensions
Optional extended levels: 2.000, 2.618, 4.236
6. Invalidation Levels
Shows the price level where the wave count becomes invalid – helping you know when your analysis is wrong.
Settings Explained
Impulse Wave Settings
Pivot Length: Sensitivity of wave detection (recommended: 5, 7, 14)
Strict Mode: Enforce all classic Elliott rules
Min Wave 3 Extension: Minimum ratio for Wave 3 (default: 1.618)
Diagonal Wave Settings
Allow Wave 4-1 Overlap: Required for valid diagonals
Extend Trendline: Project diagonal boundaries forward
Projection Settings
Fibonacci Levels: Customize retracement targets
Extension Bars: How far projections extend on chart
Pattern Management
Max Patterns: Limit displayed patterns to reduce clutter
Pattern Lifetime: Auto-remove old patterns after X bars
Use Cases
Trend Trading: Enter on Wave 3 or Wave 5 breakouts
Reversal Spotting: Diagonal completion often signals reversals
Target Setting: Use Fibonacci extensions for take-profit levels
Risk Management: Invalidation levels provide clear stop-loss references
Notes
This indicator uses pivot detection and may repaint – signals are confirmed after the specified pivot length
Designed for educational and analytical purposes, not as a signal generator
Elliott Wave analysis is subjective – this is my algorithmic interpretation
Works best on liquid markets with clear trend structure
Not financial advice – always do your own research
Re-publishing Notice
This indicator was previously blocked due to some house rule violations on my part. I've recently had time to review and fix those issues, and I'm now re-publishing a compliant version. Thanks for your patience!
Feedback Welcome
I'm still learning Elliott Wave theory myself, so if you spot any issues or have suggestions for improvement, please leave a comment. Let's learn together!
Happy trading! 📈

DT Key LevelsThis indicator provides you with key levels and pivot points.
Asia high
Asia low
Asia EQ
Daily pivot
PDH
PDL
PWH
PWL
EQ
Resistance level 1,2 & 3
Support level 1,2 & 3

AperonFx Pivot Points 1.1This indicator plots ATR-based pivot levels with a clean, institutional layout.
The central pivot (P) is calculated from the selected timeframe and price formula, while support and resistance levels are placed at equal distance steps above and below the pivot.
Users can choose between an automatic step based on ATR or a fixed price step for fully controlled, symmetric levels.
All levels are drawn as continuous segments that align precisely with the active pivot period.
Price annotations are displayed in a minimal, unobtrusive style and always match the exact level values.
The indicator is designed to remain consistent across chart timeframes without recalculation drift.
It is intended for traders who want clear, structured reference levels rather than reactive signals.

Custom RSI + Divergence + Bold Lines (v6, matched)📌 Custom RSI with Divergence & Dynamic Coloring
This indicator enhances the classic Relative Strength Index (RSI) by combining
dynamic visual feedback with automatic regular divergence detection.
It is designed to help traders quickly identify overbought / oversold conditions
and potential momentum shifts through clear and intuitive visualization.
⸻
🔍 Key Features
1️⃣ Dynamic RSI Line Coloring
• Overbought zone (RSI > Overbought level) → RSI line turns green
• Oversold zone (RSI < Oversold level) → RSI line turns red
• Neutral zone → RSI line remains white
This allows instant recognition of the current RSI state.
⸻
2️⃣ Overbought / Oversold Visual Highlighting
• Clear overbought and oversold reference lines
• Background shading when RSI enters these zones
→ improves signal visibility and reaction speed
⸻
3️⃣ Automatic Regular Divergence Detection
• Bullish Divergence
• Price makes a lower low
• RSI makes a higher low
• Pivot lows are connected with a bold green line
• Bearish Divergence
• Price makes a higher high
• RSI makes a lower high
• Pivot highs are connected with a bold red line
Pivot points are connected directly, making divergence structures easy to identify at a glance.
⸻
4️⃣ Clear Signal Markers
• Bullish divergence: ▲ (bottom of the RSI pane)
• Bearish divergence: ▼ (top of the RSI pane)
⸻
⚙️ Inputs
• RSI Length
• Overbought / Oversold Levels
• Pivot Length (controls divergence sensitivity)
⸻
💡 How to Use
• Oversold + Bullish Divergence → Potential rebound setup
• Overbought + Bearish Divergence → Potential pullback or reversal
• Best used in combination with trend analysis, support/resistance, and volume
⸻
⚠️ Notes
• Divergence signals are probabilistic, not guaranteed.
• In ranging markets, divergences may appear more frequently.
• Always apply proper risk management.
⸻
🎯 Best For
• Traders who actively use RSI
• Traders looking for clean and intuitive divergence visualization
• Users who prefer minimal but informative indicators

For Vietnamese: 3D Volume Weighted Liquidity LevelIntroduction
The 3D Volume Weighted Liquidity Level indicator visualizes market structure by identifying key support and resistance zones based on Pivot Highs and Lows. Unlike standard support/resistance lines, this tool adds a "3D" dimension by calculating the depth of the zone based on Accumulated Volume and Volatility (ATR). This helps traders visualize the "weighted" or significance of a specific price level.
Key Features
- 3D Visualization: Draws geometric boxes connecting similar Pivot points to create clear structural zones.
- Volume & Volatility Depth: The height (depth) of the box is not random. It is calculated dynamically using the accumulated volume between pivots multiplied by the ATR. Thicker boxes imply higher volume accumulation and volatility at that level.
- Liquidity Grab Detection: The indicator automatically detects and highlights bars that "grab liquidity" (break the top of a resistance box or the bottom of a support box), signaling potential stop hunts or reversals.
- Customizable Sensitivity: Users can adjust pivot lengths, search depth, and the volume scaling factor to fit different timeframes and assets.
How to Use
- Support & Resistance: Use the Blue Boxes as potential Support zones and Red Boxes as potential Resistance zones.
- Trend Reversals: Watch for the Liquidity Grab signals (colored bars). If price pierces a box but fails to close significantly beyond it, it often indicates a trap or a reversal setup.
- Volume Analysis: Pay attention to the thickness of the boxes. A thicker box suggests that a significant amount of volume was traded to form that structure, making it a stronger level of interest.

Auto Trend Channels OXEThis indicator automatically detects and draws trend channels based on swing highs and lows.
How it works:
It identifies pivot points (swing highs/lows) using your chosen lookback period, then connects consecutive pivots to form channels:
Descending channels connect lower highs (resistance line), with a parallel support line projected from the lowest low between those highs
Ascending channels connect higher lows (support line), with a parallel resistance line projected from the highest high between those lows
Key features:
Channels extend forward so you can see where price might interact with them
Broken channels automatically switch to dashed lines and show "✗" labels
Fill shading helps visualize the channel zone
Info table shows current pivot counts
Trading application:
You'd use this for identifying trend direction and potential reversal zones. Price bouncing off channel boundaries = continuation. Price breaking through = potential trend change or acceleration. The "break detection" highlighting makes it easy to spot when a channel has been invalidated.
The pivot length setting is your main control - higher values find longer-term, more significant channels; lower values catch shorter-term moves.

⚔️ The Scalpel⚔️ THE SCALPEL v2.0
━━━━━━━━━━━━━━━━━━━━━━━━━━━━━━━━━━━━━━━━━━━━━━━━━━━━━━━━
Surgical-Grade Market Structure Detection System
🔬 WHAT IS THE SCALPEL?
The Scalpel is a precision-engineered market structure analyzer that identifies and tracks critical support and resistance zones with surgical accuracy. Unlike conventional S&R tools that flood your chart with noise, The Scalpel cuts through the clutter to reveal only the most significant price structures.
━━━━━━━━━━━━━━━━━━━━━━━━━━━━━━━━━━━━━━━━━━━━━━━━━━━━━━━━
⚙️ CORE TECHNOLOGY
▸ Pivot-Based Detection Engine
Advanced pivot analysis calibrated by user-defined precision settings
▸ Tissue Integrity Validation
Filters structures based on candle body-to-range ratios
▸ Dynamic Stress Analysis
Tracks zone interactions and removes exhausted levels automatically
▸ Volatility-Adaptive Zones
Zone width scales with ATR for consistent performance across all markets
━━━━━━━━━━━━━━━━━━━━━━━━━━━━━━━━━━━━━━━━━━━━━━━━━━━━━━━━
🎨 VISUAL SPECTRUM
💜 STERILE ZONES (Electric Violet)
Fresh, untested structures with maximum potential
🔴 COMPRESSION ZONES (Magenta Fire)
Tested resistance ceilings under selling pressure
🩵 FOUNDATION ZONES (Neon Teal)
Tested support floors with proven buyer interest
✨ PLASMA AURA EFFECT
Multi-layered glow effect for enhanced visibility
━━━━━━━━━━━━━━━━━━━━━━━━━━━━━━━━━━━━━━━━━━━━━━━━━━━━━━━━
📐 PARAMETERS
🔪 Blade Precision (1-10)
Higher = fewer but sharper pivots detected
🩺 Tissue Integrity % (30-90)
Minimum candle body percentage required
📏 Incision Depth (0.1-2.0 ATR)
Controls zone thickness based on volatility
💉 Stress Threshold (1-10)
Maximum touches before zone invalidation
📐 Projection Range (10-200)
How far zones extend into the future
━━━━━━━━━━━━━━━━━━━━━━━━━━━━━━━━━━━━━━━━━━━━━━━━━━━━━━━━
💡 HOW TO USE
1. Fresh sterile zones (violet) are your highest-probability setups
2. Watch for price reaction at zone boundaries
3. Tested zones confirm structure but may have diminished strength
4. Zones auto-remove after stress threshold is reached
5. Use projection range to anticipate future tests
━━━━━━━━━━━━━━━━━━━━━━━━━━━━━━━━━━━━━━━━━━━━━━━━━━━━━━━━
🎯 BEST FOR
✓ Scalping & Day Trading
✓ Swing Trade Entries
✓ Stop Loss Placement
✓ Take Profit Targeting
✓ Multi-Timeframe Analysis
━━━━━━━━━━━━━━━━━━━━━━━━━━━━━━━━━━━━━━━━━━━━━━━━━━━━━━━━
⚠️ DISCLAIMER
This indicator is for educational purposes only. Always conduct your own analysis and use proper risk management. Past performance does not guarantee future results.
━━━━━━━━━━━━━━━━━━━━━━━━━━━━━━━━━━━━━━━━━━━━━━━━━━━━━━━━
🏷️ TAGS
support resistance zones SNR pivot points market structure scalping day trading swing trading price action order blocks smart money supply demand technical analysis
